 Building a Stock Analytics App with Snowflake and CoCo AI – An Evening Project That Got a Bit Out of Hand
  Are you expecting a lower pay rise next year
  What does the 1984 The Terminator movie and the 2024 EU AI Act have in common?
  A Tale of Two Transformations
  With Pure Storage’s recently announced extended partnership with Microsoft Azure – You might be thinking “Why on earth would Azure want their customers to reduce their cloud spend?” What’s in it for Microsoft?
  A hug, a kiss, a shake, a bro-hug?
 *Or: How I spent an evening talking to an AI assistant and ended up with a fully-fledged earnings analysis dashboard*
It started as I was pondering a simple question: “Can I build something useful with Snowflake’s AI capabilities, not to do with the day job, and without writing reams of boilerplate code?“
The answer, it turns out, is a resounding yes. But let me take you on the journey.
The Idea
I’ve always been curious about how stock prices react to earnings announcements. You know the drill – a company reports quarterly earnings, and depending on whether they beat or miss analyst expectations, the stock either rockets up or takes a nosedive. Sometimes both in the same day. It’s financial theatre at its finest. With Snowflake and Pure Storage about to announce their FY26 Q4 earnings in a few days, I wanted to test some theories I had….
I wanted to build something that would let me:
1. Track stocks I’m interested in
2. See historical price movements around earnings events
3. Get AI-powered insights on patterns
4. Generate downloadable reports I could review offline
Simple enough, right?
The Tech Stack
Here’s what I ended up using:
- Snowflake – for data storage and compute
- Streamlit in Snowflake (SiS) – for the dashboard UI
- Snowflake Cortex AI – for the intelligent analysis bits
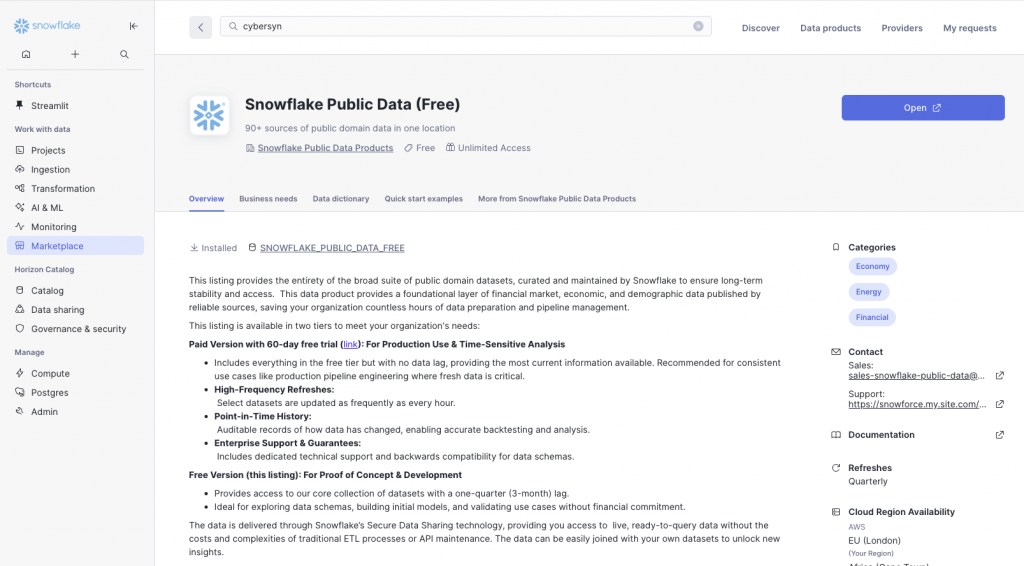
- Cybersyn marketplace data – free financial data (earnings events, stock prices)
- Yahoo Finance API – for live prices
- Cortex Analyst & Snowflake Intelligence – for natural language querying
The beauty of this stack is that almost everything runs inside Snowflake. No spinning up separate servers, no managing infrastructure, no “works on my machine” headaches. I’ll share some of my CortexCode prompts as I go through the story….
Step 1: Getting the Data
First things first – I needed data. Snowflake’s Marketplace is genuinely brilliant for this. Cybersyn provides free financial datasets that include earnings call events and historical stock prices. A few clicks and I had access to years of earnings data for thousands of companies.
The next task was to explain to CoCo (Cortex Code) what I wanted to do:
I’ve added the cybersyn data source to my account. Can you help me create a new database in my account that retrieves some selected stock ticker values from that data and stores them in my own tables. I want to record just the opening and closing daily prices for each ticker. As you do so, please prompt me whenever you need to create a database or table, suggesting field names etc. , but offering defaults too. My intention is to build a database that stores as much historic data on selected stock tickers as possible. I want to retrieve the 10K annual reports for the same time period of the ticker data, and I want to store those reports in my accounts (for later AI analysis). I also want to retrieve the earnings call dates for each quarter for each ticker. To make all of this easier to manage – I’d like you to create a streamlit dashboard that will allow me to select a ticker symbol from each or any of the major stock exchanges globally. After selection – i’d like my own copies of the data tables to be populated with the ticker data, 10K or annual report content, and any other useful financial data you can use from the data source – such as analysts consensus for the ticker i select. As you progress, if you think you have better ideas for how to structure the data, then prompt me and ask me if I want to adopt those ideas. The ultimate aim here is to be able to analyse historic price movements of a stock ticker in the 5 days prior and 5 days post an earnings call. I will also like to correlate that with the analyst consensus in the same time frame. It would be great if you could create a Streamlit with useful financial analysis capabilities and graphics to support this kind of analysis.
CoCo went off and found the ticker data sources, ran a bunch of queries so it could understand the structure, and came back with this:
Now I have a good understanding of the data. Let me create a comprehensive plan and ask you about the database structure:
Design and create database schema with user input on naming (1/7)
Based on my analysis, here’s what the Cybersyn data offers:
Available Data Summary:
Important Note: The stock price data is Nasdaq-only, not all global exchanges. For global coverage, you’d need a paid data source.
| Data Type | Source Table | Coverage |
|---|---|---|
| Stock prices | STOCK_PRICE_TIMESERIES | 21,572 tickers, May 2018 – Nov 2025 (Nasdaq only) |
| Earnings Calls | COMPANY_EVENT_TRANSCRIPT_ATTRIBUTES | 9,000+ companies, JSON transcripts |
| 10-K Annual Reports | SEC_CORPORATE_REPORT_ITEM_ATTRIBUTES | Full text/HTML/JSON by section |
| Company Index | COMPANY_INDEX, COMPANY_SECURITY_RELATIONSHIPS | Maps tickers to CIK, FIGI, etc. |
CoCo went off and created a schema (`STOCK_ANALYTICS_DB.FINANCIALS`) to hold:
- WATCHED_TICKERS – the stocks I want to track
- DAILY_PRICES – OHLC price data pulled from Cybersyn
- EARNINGS_EVENTS – earnings call dates and transcripts
- ANALYST_RATINGS – consensus ratings and price targets
- AI_INSIGHTS_CACHE – to avoid hammering the AI with repeat requests
Step 2: Building the Streamlit Dashboard
Streamlit in Snowflake is one of those technologies that makes you wonder why everything isn’t this easy. You write Python (well, CoCo writes it for you), it renders a web app, and it all runs securely inside Snowflake. No deployment pipelines, no containers, no faffing about.
The dashboard evolved over several iterations. What started as a simple price chart became a bit of a seven-tab monster as i repeatedly asked CoCo to add fuctionality. I also found it useful to ask CoCo to come up with its own ideas to make the dashboard cleaner, more useful and usable!
- Ticker Selection – search and add stocks to track
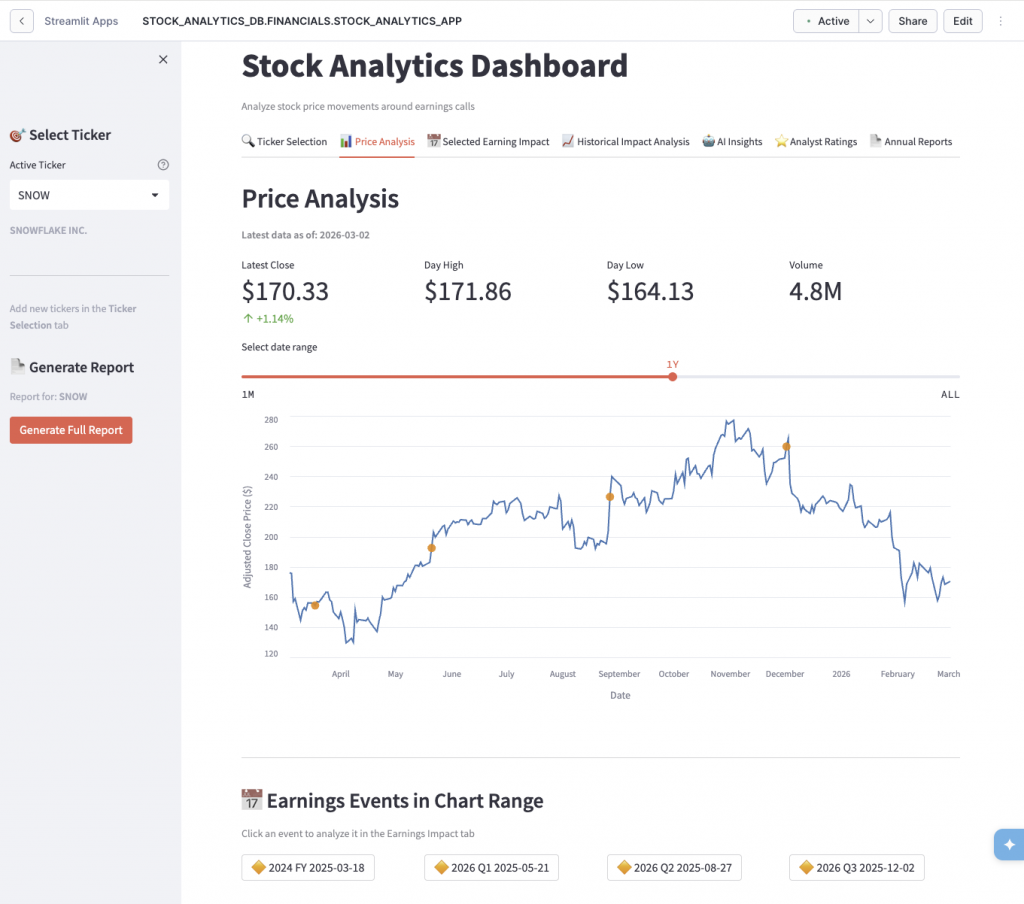
- Price Analysis – interactive price charts with earnings markers
- Selected Earnings Impact – deep dive into specific earnings events, by clicking on the chart
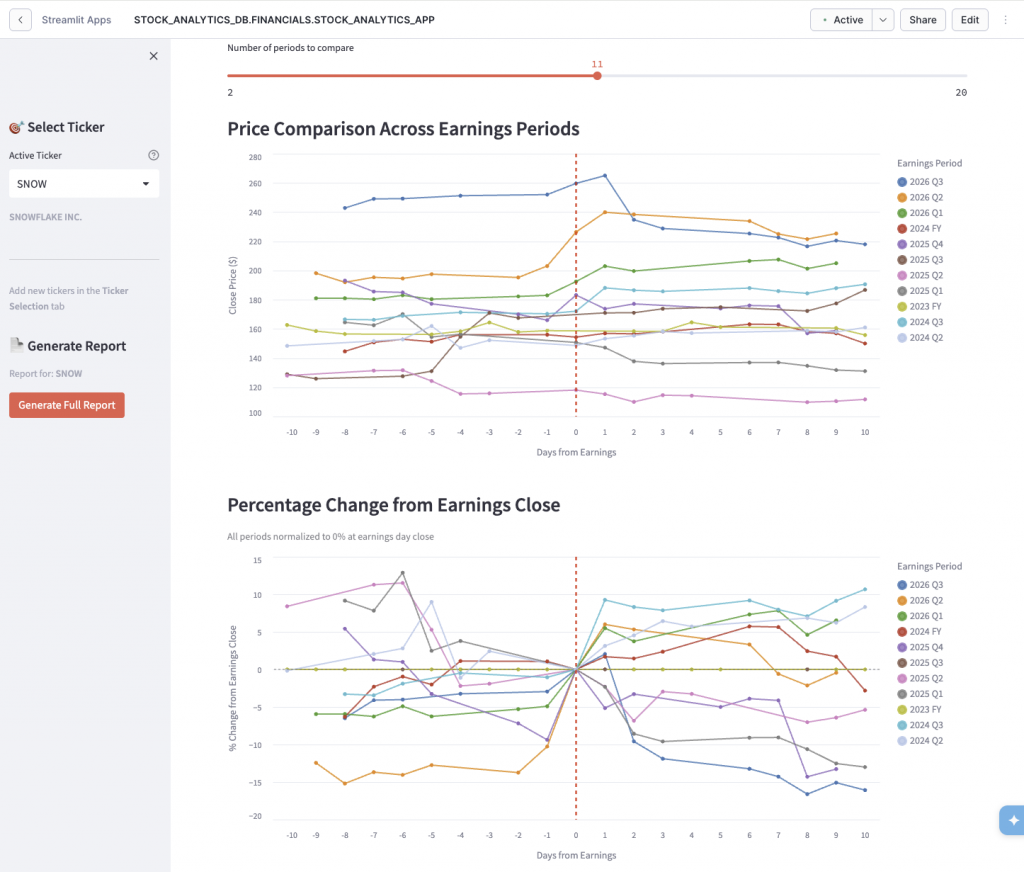
- Historical Impact Analysis – overlay multiple earnings periods to spot patterns
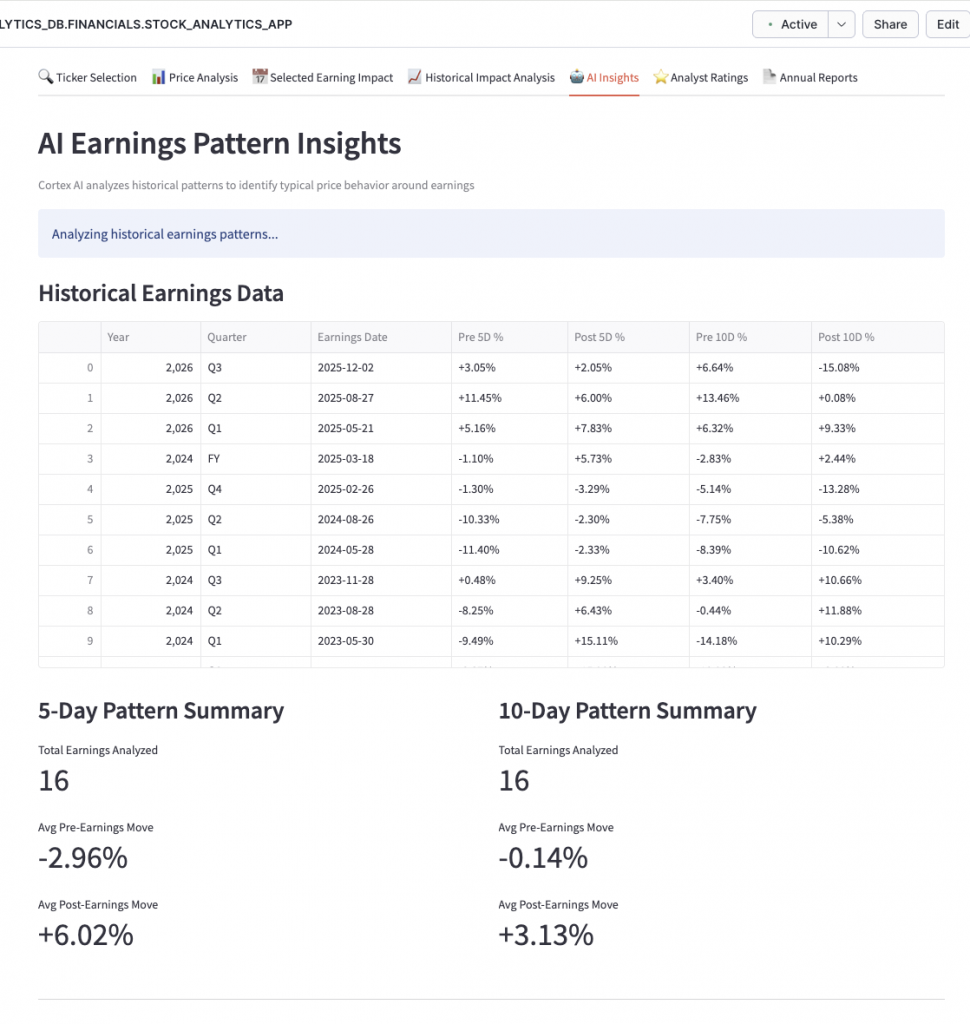
- AI Earnings Pattern Insights – Cortex AI analysis of price behaviour
- Analyst Ratings Analysis – see how accurate analysts have been
- 10-K Annual Reports – dig into company filings
One feature I’m particularly pleased with is the “Percentage Change from Earnings Close” chart. It normalises all historical earnings periods to 0% at the earnings date, so you can overlay multiple periods and actually see patterns. Does the stock typically run up before earnings? Does it sell off after? The chart makes it obvious. This was actually CoCo’s idea – and it was much better than my own.
Step 3: Adding AI Insights
This is where Snowflake Cortex comes in. Rather than just showing raw data, I wanted the app to actually *analyse* what it was seeing, and i wanted to be able to ask questions of my data without having them pre-described. Using Cortex’s `llama3-8b` model, the app generates AI summaries of earnings patterns:
“Based on the last 8 earnings events, SNOW typically sees a 3-5% run-up in the 5 days before earnings, followed by elevated volatility post-announcement. The stock has beaten analyst expectations 6 out of 8 quarters, yet price reaction has been mixed…”
I did notice a few seconds delay every time I ran the analysis. The trick here was to implement some caching. AI inference isn’t free, and you don’t want to regenerate the same analysis every time someone loads the same page. CoCo suggested adding a 24-hour TTL cache in a Snowflake table – if the analysis is fresh, serve from cache; otherwise, generate new.
While my Cybersyn ticker data source was free – it is not an up to date source of stock ticker data… so guess what – I asked CoCo for some suggestions on where and how i could get accurate stock ticker data (pr at least to the usual 15 minute delay). CoCo came back with a few suggestions, and i asked it to help me choose between 2:
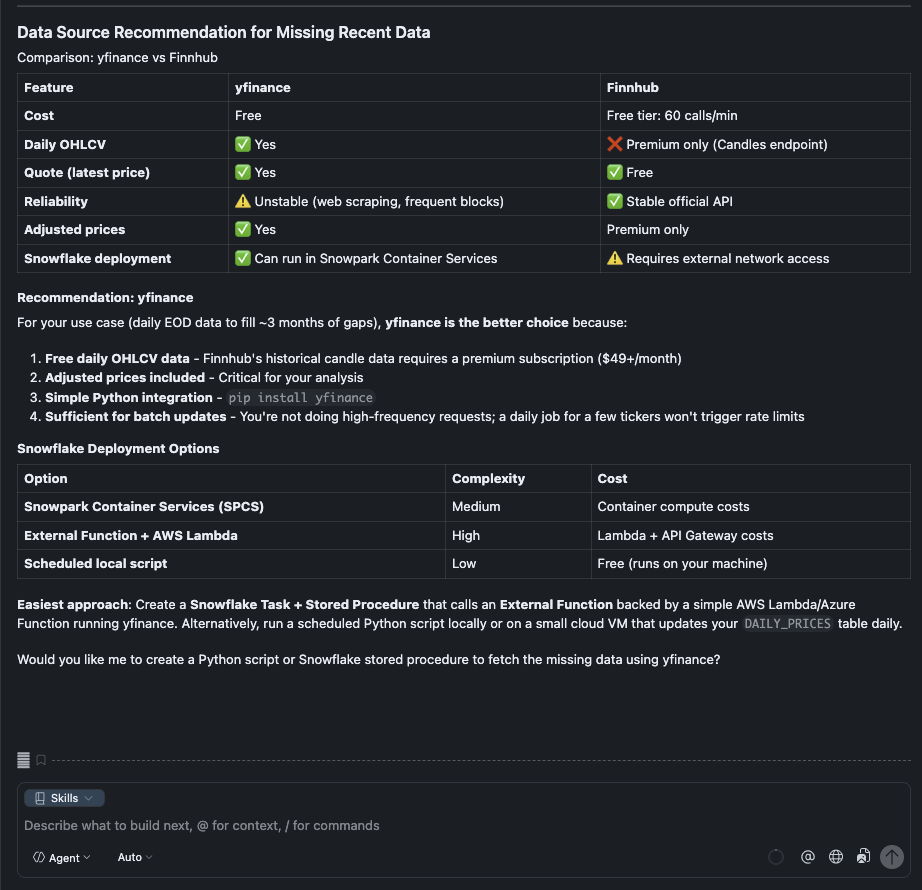
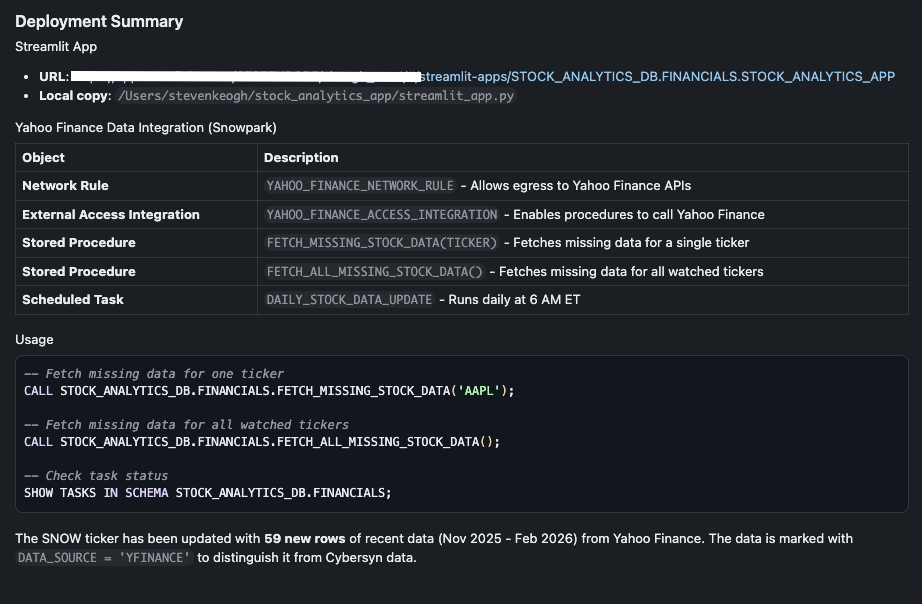
Duh! yes please, write the python script for me CoCo…… and off it went to write the script and deploy it in Snowpark Container Service (SCS), fetched the missing data and updated the ticker tables….
Step 4: Natural Language Queries with Snowflake Intelligence
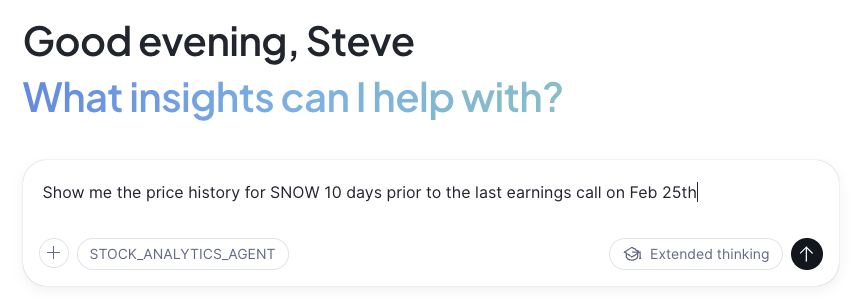
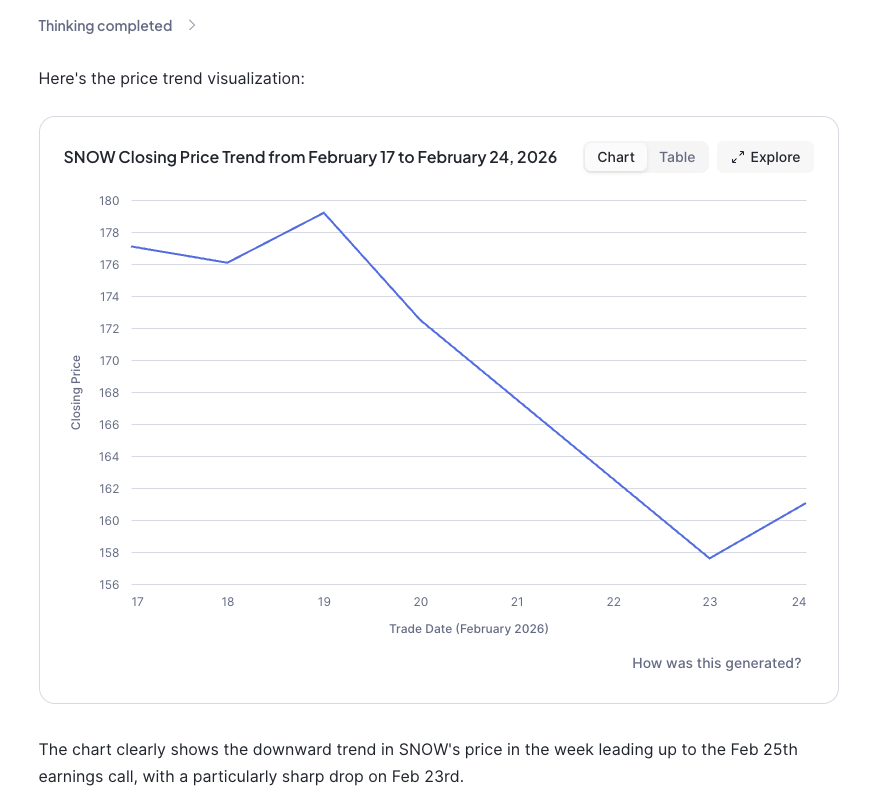
The final piece of the puzzle was making the data queryable in natural language. “What was the closing price for SNOW last week?” shouldn’t require writing SQL.
This meant asking CoCo to create:
- A Semantic View – a YAML definition that tells Cortex Analyst how to interpret natural language queries against my tables
- A Cortex Agent – the interface that processes questions and generates SQL
The semantic view was probably the fiddliest part. You need to define your tables, their relationships, dimensions (things you filter/group by) and facts/metrics (things you measure). Get it wrong and the AI generates nonsense SQL. Get it right and it’s genuinely magical.
```yaml
name: STOCK_ANALYTICS_VIEW
tables:
- name: DAILY_PRICES
dimensions:
- name: TICKER
description: Stock ticker symbol (e.g., AAPL, MSFT)
- name: TRADE_DATE
description: The date of the trading session
facts:
- name: CLOSE_PRICE
description: Closing price of the stock for the day
metrics:
- name: AVG_CLOSE_PRICE
expr: AVG(CLOSE_PRICE)
description: Average closing price```
Once deployed, I can open Snowflake Intelligence and ask things like:
- “What stocks are we tracking?”
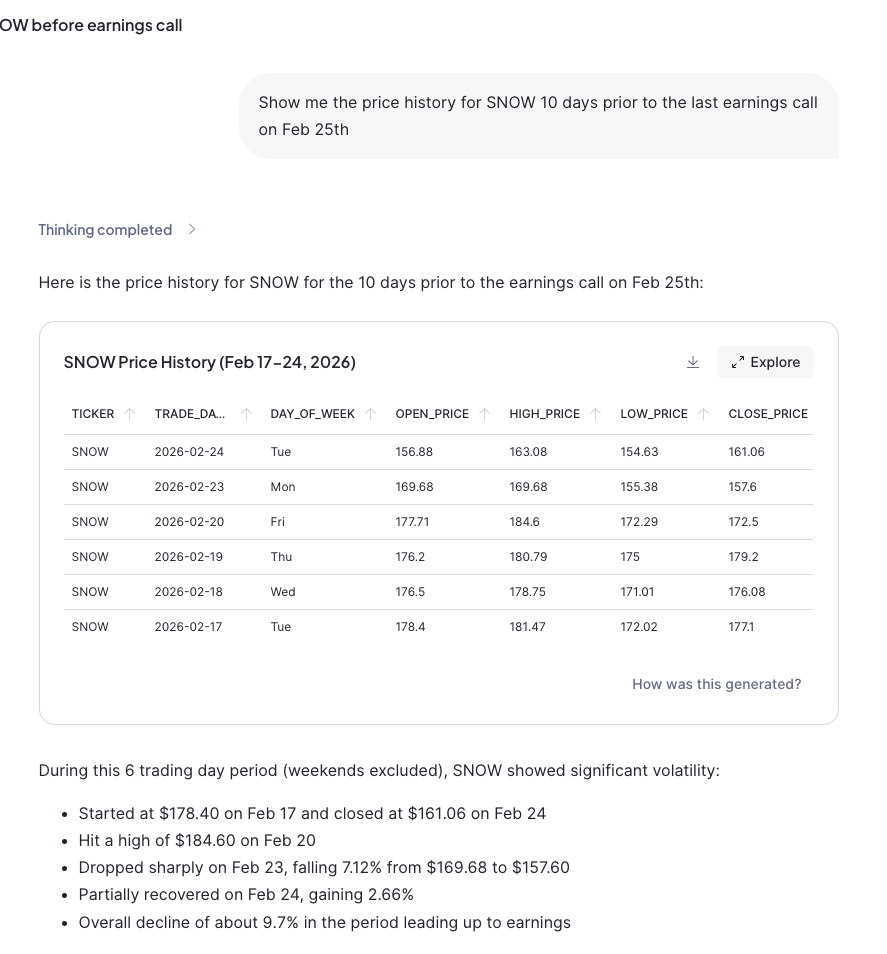
- “Show me the price history for Snowflake”
- “What was the trading volume for PSTG yesterday?”
And it just… works. The agent figures out the SQL, runs it, and presents the results.
What Did I Learn?
This whole exercise start to finish took about 4 hours. A few things stood out:
- Streamlit in Snowflake is production-ready. I was sceptical at first – surely there’d be limitations that made it a toy? Nope. It handled everything I threw at it.
- Cortex AI is surprisingly capable. The pattern analysis it generates is genuinely useful, not just marketing fluff.
- Semantic Views require patience. The YAML syntax is particular, and error messages can be cryptic. Budget time for iteration.
- Global state in Streamlit needs care. I refactored the ticker selection three times before landing on a sidebar-based global selector that persists across tabs.
- AI-assisted development is a game-changer. I built this entire app using Snowflake’s Cortex Code assistant. The back-and-forth of “try this, fix that, add this feature” felt genuinely collaborative. When my internet connection dropped (twice!), we just picked up where we left off.
The cynics amongst you (myself included) might say that i could have just asked Gemini or ChatGPT to answer my questions, and yes, I guess i could. But the point here is that this app was developed on ‘my’ data, and did exactly what I wanted it to do. For an enterprise, yes, you could deploy Gemini on your corporate data, but a lot of that data, the most factual and business relevant data is locked away in structured and un-structured data sets and other disparate corporate systems. Snowflake and Cortex let you develop AI and analytics on that data, and apply Cortex reasoning and inference to your own data, in the way you want to govern, control and receive it.
—
If you’re curious about Snowflake’s AI capabilities, I’d encourage you to have a play. The combination of Streamlit, Cortex AI, and Snowflake Intelligence makes building intelligent data apps far more accessible than it used to be.
No GPUs required. 😉
—
*The full code and semantic model definitions are available on request. Feel free to reach out on [LinkedIn](https://www.linkedin.com/in/stevenkeogh/) if you want to chat about the implementation.*
**Tags:** Snowflake, AI, Streamlit, Cortex, Stock Analytics, Data Apps, Snowflake Intelligence
![]()
You may also like
-
What does the 1984 The Terminator movie and the 2024 EU AI Act have in common?
-
A Tale of Two Transformations
-
With Pure Storage’s recently announced extended partnership with Microsoft Azure – You might be thinking “Why on earth would Azure want their customers to reduce their cloud spend?” What’s in it for Microsoft?
-
A hug, a kiss, a shake, a bro-hug?
-
A Perfect Storm for Tech Innovators.