 One Year of Home Solar – Was it Worth it? A Real-World ROI Analysis
  Building a Stock Analytics App with Snowflake and CoCo AI – An Evening Project That Got a Bit Out of Hand
  Are you expecting a lower pay rise next year
  What does the 1984 The Terminator movie and the 2024 EU AI Act have in common?
  A Tale of Two Transformations
  With Pure Storage’s recently announced extended partnership with Microsoft Azure – You might be thinking “Why on earth would Azure want their customers to reduce their cloud spend?” What’s in it for Microsoft?
 ![]()
Back in October 2022, I wrote a post about how rising electricity costs were actually a good thing – at least for driving people to act. In that post I said “Get those solar panels, buy into that wind farm collective, switch off your old and power hungry devices.”
Well, I took my own advice.
In April 2025, I had a solar panel system and a Tesla Powerwall 3 battery installed on my home. Total cost: £24,000. That’s a big number. A really big number. The kind of number that makes you lie awake at night wondering if you’ve made a terrible financial decision.
So after 12 months of operation, I decided to find out. Not with back-of-the-envelope guesswork or the rosy projections from the solar installer’s sales brochure – but with actual, measured data from my utility company, my Tesla Powerwall, and my myenergi monitoring system.
Here’s what I found.
My Setup
Before we dive into the numbers, here’s what I’m working with:
- Solar panels split across three rooftops, two of which are slate roof tiles, and a flat garage roof (split 11 East,11 South West,8 South East mounted at 30 degrees – for 30 panels in total)
- Two Tesla Powerwall 3 27KW of battery for storage, 22kWh max output
- myenergi Eddi hot water diverter – this takes surplus solar that can’t be exported (above my 5kW grid export limit) and diverts it to heat the hot water tank
- Electric vehicle – charged almost exclusively on the off-peak overnight tariff
- Time-of-use electricity tariff – cheap overnight (23:30–05:30), standard rate during the day (05:30–23:30)
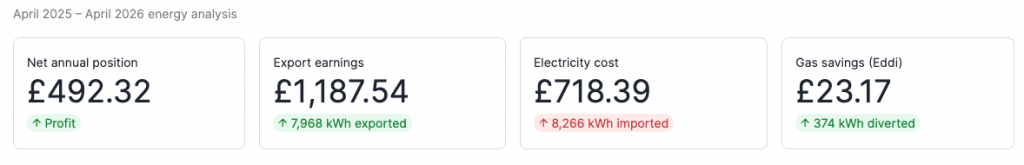
The analysis period is April 2025 to April 2026 – a full 12 months.
The Data Sources
I pulled data from four places:
- Grid import – half-hourly electricity consumption from the grid (17,474 readings from my utility company)
- Grid export – half-hourly electricity exported back to the grid (17,040 readings)
- myenergi – hourly readings from the Eddi hot water diverter (8,661 readings)
- Tesla Powerwall – monthly solar generation totals
- EV charging – per-session charging data (55 sessions)
The Maths – How I Calculated ROI
This is where it gets interesting. There are several components to the “value” of a solar system, and most online calculators only look at one or two of them. I wanted the full picture.
1. Electricity Export Earnings
This is the easy one. Every kWh you export to the grid, you get paid for. My export tariff varied slightly over the year, but the principle is simple:
Export earnings = kWh exported x export rate per kWh
Over 12 months I exported 7,968 kWh and earned £1,187.54.
That’s a lot of electricity going back to the grid – primarily during the sunny months. In June alone I exported over 1,300 kWh.
2. Gas Savings from the Eddi Diverter
The myenergi Eddi is clever. When the solar panels are generating more than the house needs, and the battery is full, and you’re already exporting the maximum 5kW to the grid – the Eddi diverts the remaining surplus to heat the hot water tank. Every kWh diverted to the heater is a kWh of gas you didn’t have to buy.
Gas savings = kWh diverted to heater x gas rate per kWh
Over 12 months: 374 kWh diverted, saving £23.17 in gas.
I know – not exactly a fortune. The Eddi only kicks in when everything else is saturated, so it’s a relatively small contributor. But every little helps.
3. Electricity Savings – The Big One
This is where most simple ROI calculations fall down. They look at what you earn from solar (export + gas) but ignore what you save by not buying electricity you would have otherwise needed.
Think about it: during the day, your solar panels are powering your home. That’s electricity you’re not buying from the grid at peak rates. To calculate this, I needed to answer a fundamental question:
“What would my electricity bill have been if I didn’t have solar panels?”
Working Out True Home Consumption
This is trickier than it sounds. You can’t just look at how much you imported from the grid, because with solar panels you’re importing far less than you would otherwise.
The formula I used:
True home consumption = Solar generated + Grid import – Grid export
Think of it this way: your solar panels generated electricity. Some of it went into the house (self-consumption), some went to the grid (export), and you also pulled some from the grid (import). The total your home actually used is the solar generation, plus whatever extra you needed from the grid, minus whatever you sent away.
Over 12 months:
| Component | kWh |
|---|---|
| Solar generated | 10,310 |
| Grid import | 8,266 |
| Grid export | 7,968 |
| True home consumption | 10,608 |
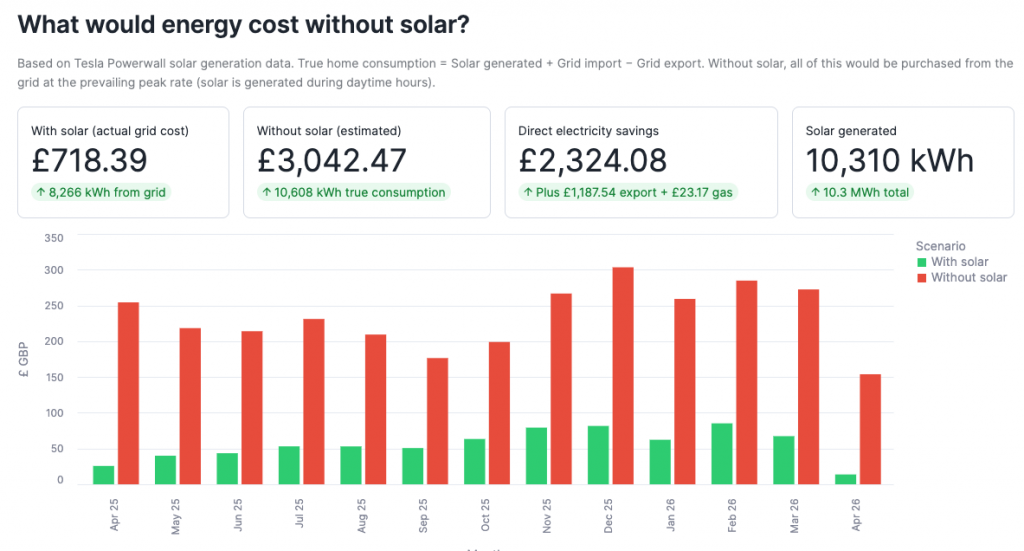
That 10,608 kWh is what my home actually consumed. Without solar, I’d have been buying all of that from the grid.
Costing the “Without Solar” Scenario
Since solar is generated during the daytime, the electricity it displaces would have been purchased at the peak daytime rate (05:30–23:30). I applied the prevailing peak rate for each month to the true home consumption figure:
Cost without solar = True home consumption x peak electricity rate
The result: without solar, my electricity bill for the year would have been £3,042.47.
My actual electricity bill (what I paid for grid imports) was £718.39.
That’s a direct electricity saving of £2,324.08.
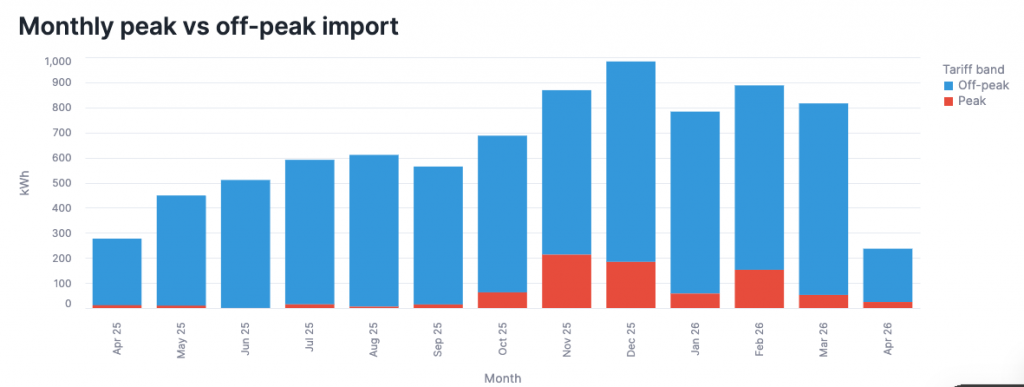
Peak vs Off-Peak – Where Did the Energy Go?
One thing I was curious about was the split between peak and off-peak electricity usage. Remember, my tariff has two rates:
- Off-peak (23:30–05:30): the cheap overnight rate
- Peak (05:30–23:30): the standard daytime rate
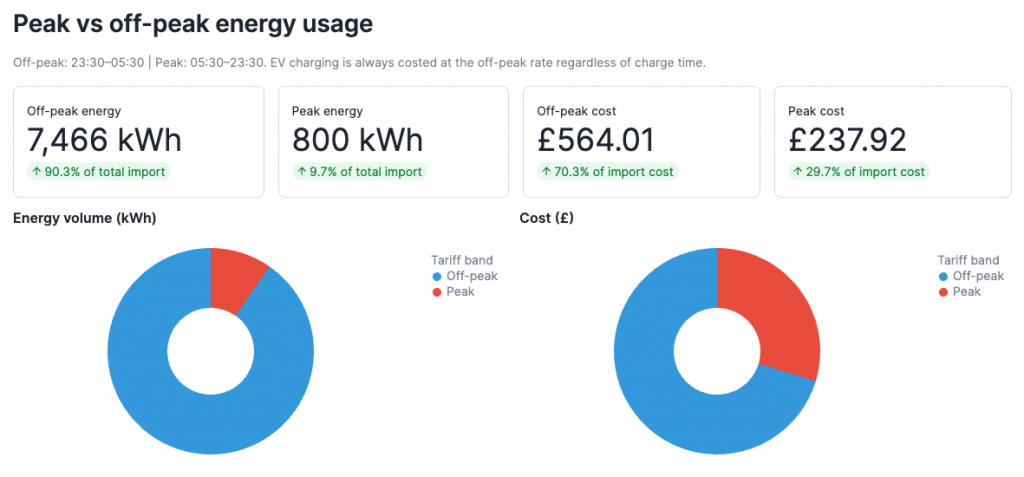
Here’s the breakdown of my grid imports:
| Band | kWh | % of Total | Cost | % of Cost |
|---|---|---|---|---|
| Off-peak | 7,466 | 90.3% | £564.01 | 70.3% |
| Peak | 800 | 9.7% | £237.92 | 29.7% |
| Total | 8,266 | 100% | £801.93 | 100% |
That’s a pretty striking split. Over 90% of my grid import is off-peak. The solar panels and battery are doing their job during the day – the house barely touches the grid during peak hours. Most of the off-peak usage is the EV charging overnight and the Powerwall recharging from the grid during the cheap hours in winter.
Even though off-peak accounts for 90% of the energy volume, it only represents 70% of the cost. That remaining 10% of peak energy punches above its weight at nearly 30% of the bill. This really highlights why time-of-use tariffs and solar are such a good combination.
EV Charging
I should mention the EV charging, because it’s relevant to the maths. Late in the year (October) I bought an EV and through the rest of the analysis period I charged the car 55 times, consuming 901 kWh. The EV is always charged on the off-peak overnight tariff – even if I occasionally plug in during the day, it’s scheduled to charge after 23:30.
In the analysis, I made sure to cost all EV charging at the off-peak rate, regardless of when it appears in the half-hourly grid import data. This is important because otherwise you’d overstate the electricity cost (the half-hourly data doesn’t know the difference between the dishwasher and the car).
The Bottom Line – Total Annual Value
Putting it all together:
| Benefit | Annual Value |
|---|---|
| Electricity savings (avoided grid purchase) | £2,324.08 |
| Export earnings (sold back to grid) | £1,187.54 |
| Gas savings (Eddi hot water diverter) | £23.17 |
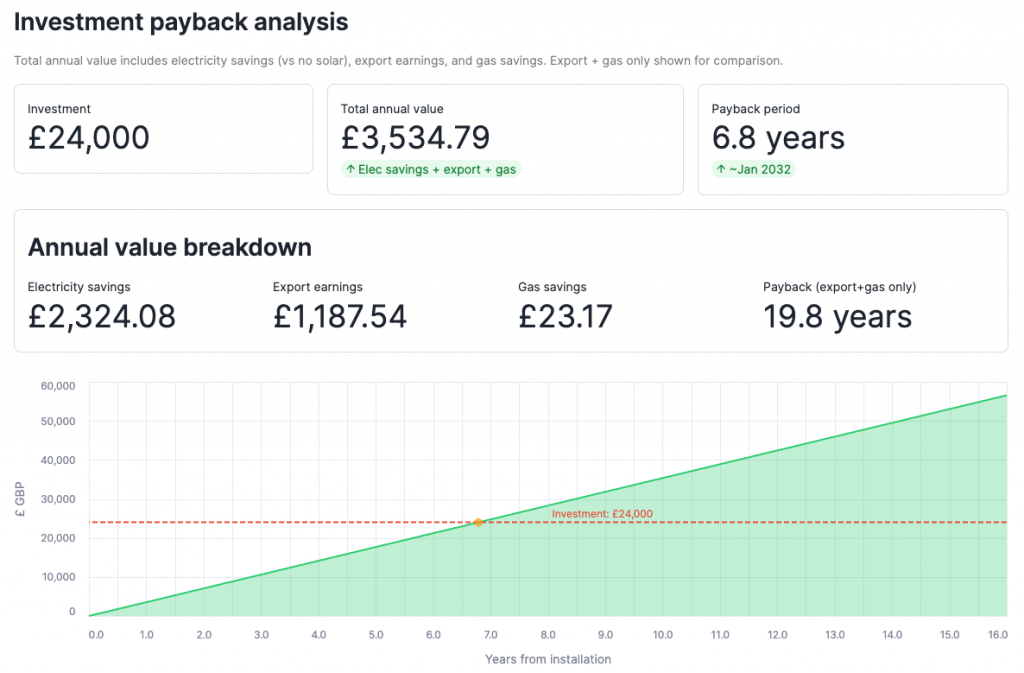
| Total annual value | £3,534.79 |
Against an investment of £24,000, that gives a payback period of 6.8 years.
Now, that’s a lot better than the number you get if you only count export earnings and gas savings (which would give you about 19.8 years). The electricity savings – what you don’t have to buy – is by far the biggest contributor.
Future Projection
Assuming the annual value stays roughly constant (and with energy prices showing no signs of going down, it might well improve):
| Years | Cumulative Benefit | Net Profit | ROI |
|---|---|---|---|
| 5 | £17,674 | -£6,326 | -26% |
| 10 | £35,348 | £11,348 | 47% |
| 15 | £53,022 | £29,022 | 121% |
| 20 | £70,696 | £46,696 | 195% |
| 25 | £88,370 | £64,370 | 268% |
By year 7, the system has paid for itself. By year 15, it’s generated more than double the original investment in value. By year 25 (well within the expected panel lifespan), you’re looking at nearly £65,000 in net benefit.
The Seasonal Pattern
As you’d expect, the system performs very differently across the seasons:
- April–September: Net positive. The long sunny days mean lots of solar generation, lots of export, minimal grid import. June was the best month – exporting over 1,300 kWh and earning nearly £201 in export alone.
- October–February: Net negative (on the export/gas metric alone). Short days, less solar, more grid import. But even in winter the system is still generating and offsetting some daytime consumption.
- March: The crossover month – the system swings back into net positive territory as the days lengthen.
What Would I Do Differently?
Honestly? Not much. The numbers speak for themselves. But a few observations:
- The battery is essential. Without the Powerwall, I’d be exporting far more during the day and importing far more in the evening. The battery lets you time-shift the solar generation to when you actually need it.
- Time-of-use tariffs are your friend. If you have solar + battery, get yourself on a tariff with a cheap overnight rate. Charge the battery and the EV overnight, run on solar and battery during the day. 90% of my grid import is off-peak – that’s the strategy working.
- The Eddi is nice-to-have, not essential. £23 in gas savings over a year isn’t going to change your life. But it’s using energy that would otherwise be wasted (I can only export at 5kW, and on a sunny day you might be generating more than that).
- Don’t trust installer projections blindly. Do the maths yourself. The data is available from your utility company and your solar monitoring system. It’s not hard, and you’ll get a much more honest picture.
Key Takeaways
If you’re considering solar panels in the UK and wondering whether the investment is worth it:
- The payback is real – my data shows 6.8 years on a £24,000 system. That’s well within the panel warranty period, let alone their operational lifespan.
- Electricity savings are the biggest benefit – not export earnings. The electricity you don’t have to buy is worth more than twice what you earn from selling the surplus.
- A battery makes a huge difference – it lets you use your own solar generation in the evening instead of buying from the grid at peak rate.
- Time-of-use tariffs amplify the benefit – cheap overnight charging (EV and battery) combined with solar self-consumption during the day is the optimal strategy.
- The numbers only get better as electricity prices rise – and they’re showing no signs of coming down.
My System Summary (Year One)
For reference, here are the headline numbers from my first full year:
| Metric | Value |
|---|---|
| Solar generated | 10,310 kWh (10.3 MWh) |
| Grid import | 8,266 kWh |
| Grid export | 7,968 kWh |
| True home consumption | 10,608 kWh |
| Electricity cost (actual) | £718.39 |
| Electricity cost (without solar) | £3,042.47 |
| Electricity savings | £2,324.08 |
| Export earnings | £1,187.54 |
| Gas savings (Eddi) | £23.17 |
| Total annual value | £3,534.79 |
| Investment | £24,000 |
| Payback period | 6.8 years |
If you found this useful, feel free to share. And if you’ve got your own solar data and want to compare notes – I’d love to hear from you. Drop me a message on LinkedIn.
Tags: solar panels, ROI, electricity costs, Tesla Powerwall, renewable energy, UK energy, payback period, home solar
You may also like
-
Building a Stock Analytics App with Snowflake and CoCo AI – An Evening Project That Got a Bit Out of Hand
-
A hug, a kiss, a shake, a bro-hug?
-
UNPOPULAR OPINION: The recent super high electricity costs are a good thing…
-
After the [projected 65%] rise in the UK October Electricity price cap – your nice new TV costs more to run than it does to buy!